Response Summary
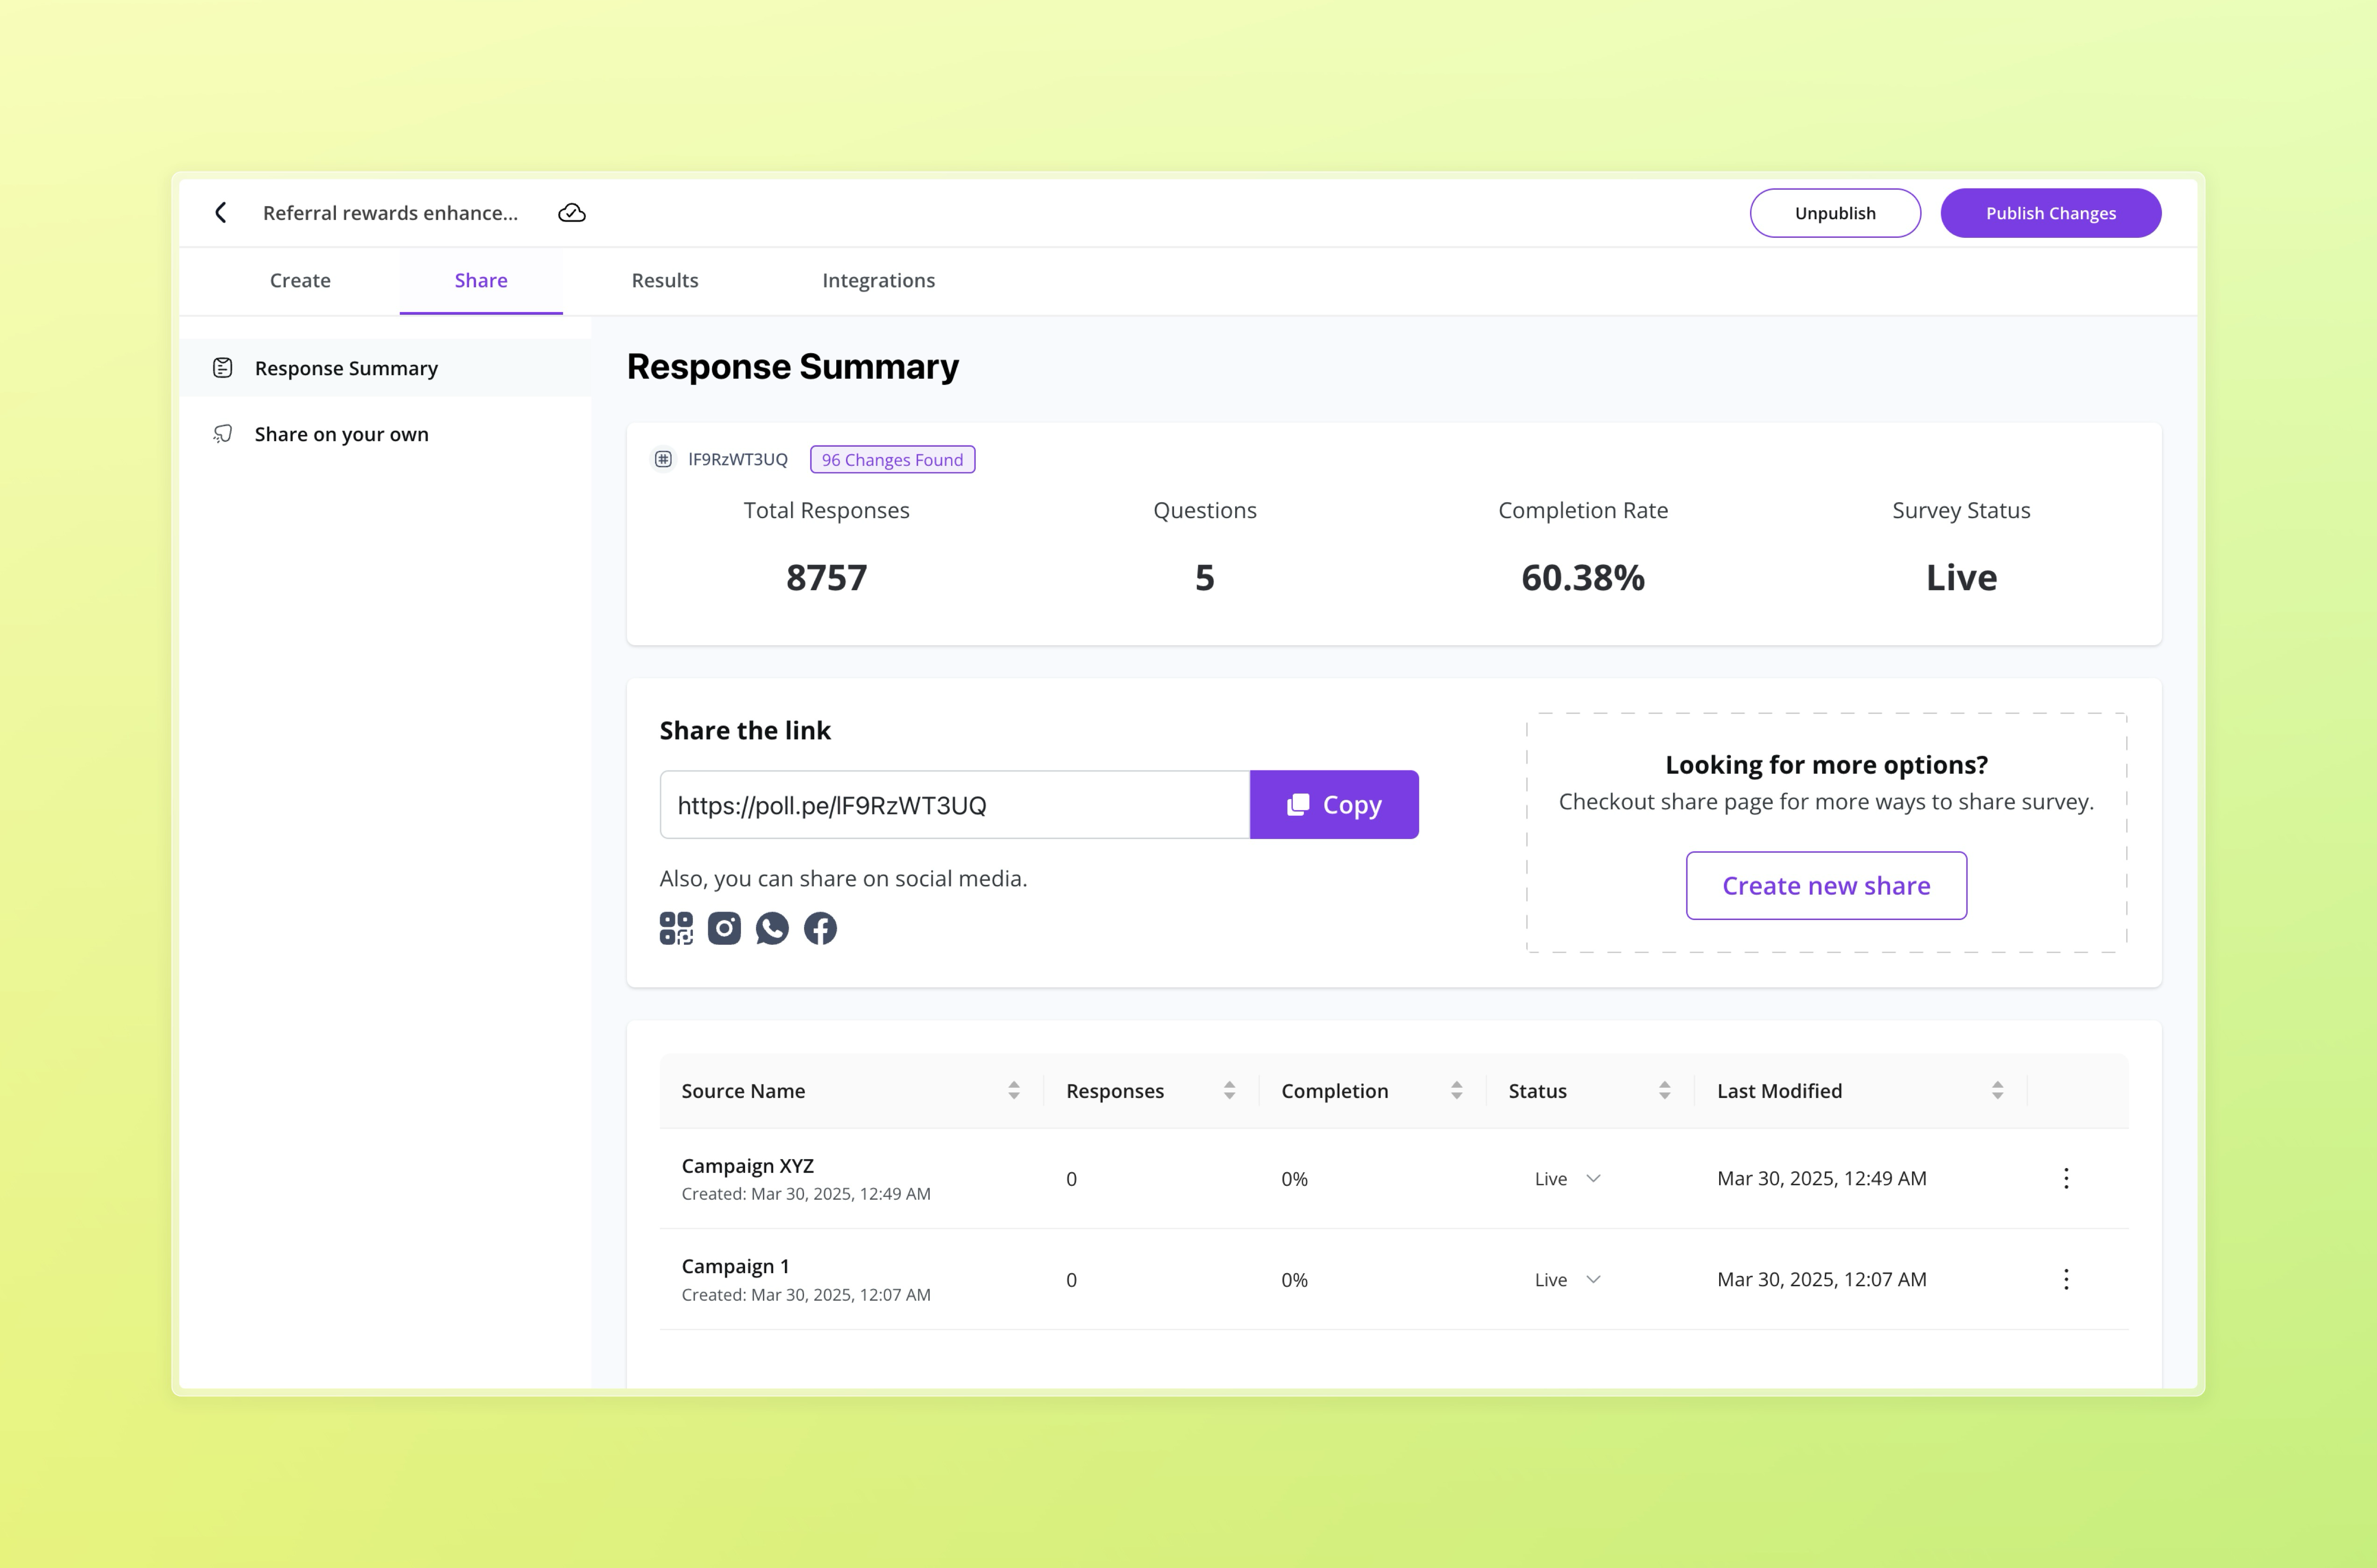
The Response Summary view gives you a high-level overview of how your survey is performing. It shows total responses, number of questions, completion rate, and survey status.
Key Metrics
- Total Responses: Total number of responses submitted for this survey.
- Questions: Number of questions in the survey.
- Completion Rate: Percentage of people who completed the entire survey.
- Survey Status: Indicates if the survey is currently Live, Paused, or Closed.
Share & Campaign Breakdown
Below the metrics, you can:
- Copy your default survey link.
- Click Create new share to generate campaign-specific links.
- View share icons for social media platforms (Facebook, Instagram, WhatsApp, X).
Track Share Performance by Campaign
Each campaign (whether created via Social Media Share, Store QR, or Email Invite) appears in the Source Name table:
- Source Name (Campaign Name)
- Responses (Count)
- Completion (Percentage)
- Status (Live, Paused)
- Last Modified timestamp
This helps you identify which source is driving traffic to your survey.
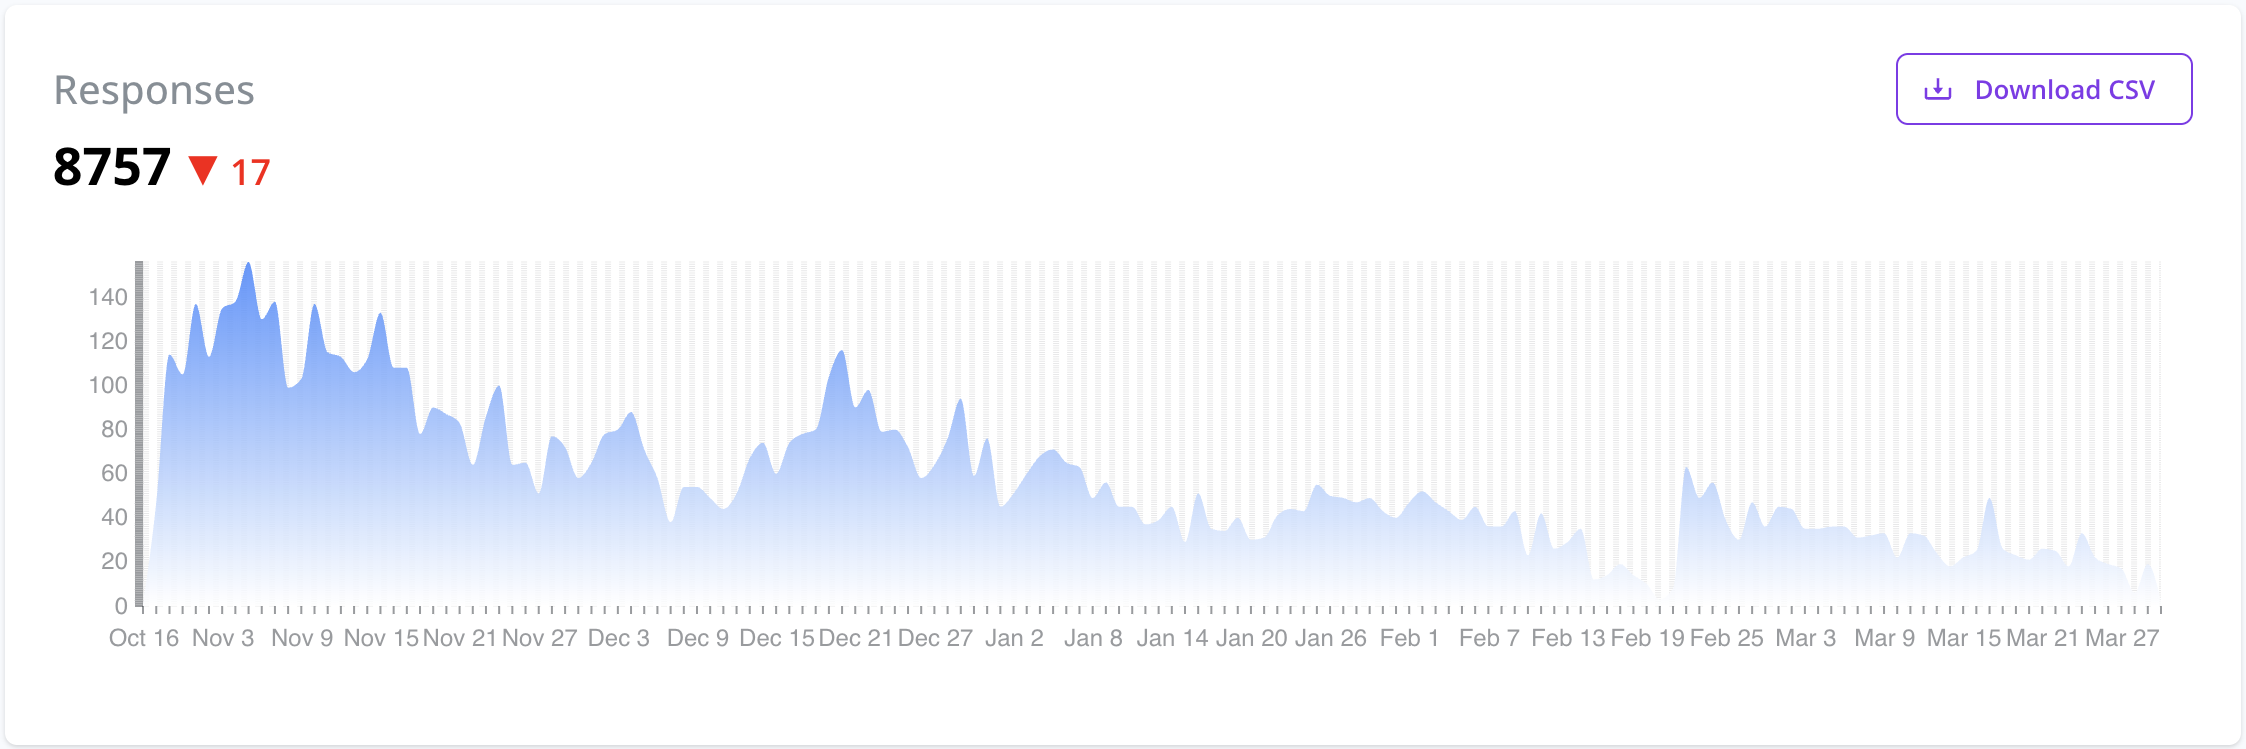
View Trends Over Time
The line chart at the bottom shows response trends by date. This helps in identifying spikes and drop-offs in engagement over time.
You can also click Download CSV to export raw data.